Stats Helpers
- problem_bank_helpers.stats.shaded_normal_density(q: float | tuple[float, float], /, mean: float = 0, sd: float = 1, rsd: float = 4, lower_tail: bool = True, add_prob: bool = True, add_q: bool = True, add_legend: bool = False, figsize: tuple[float, float] | None = (8, 6), color: Any = 'xkcd:sky blue', x_label: str = 'x', y_label: str = 'f(x; μ,σ)', legend_text: str | None = None, **kwargs) Figure[source]
Generate a normal distribution plot with optional listed probability calculation.
- Parameters:
q (float or tuple[float, float]) – If a float, the upper or lower bound of the shaded area. If a tuple of floats, the lower and upper bounds of the shaded area.
mean (float) – The mean of the normal distribution. Defaults to
0sd (float) – The standard deviation of the normal distribution. Defaults to
1rsd (float) – The number of standard deviations to plot on either side of the mean. Defaults to
4lower_tail (bool) – Whether the shaded area should represent the lower tail probability \(\operatorname{P}(X \le x)\), or the upper tail probability \(\operatorname{P}(X \ge x)\). Defaults to
Trueadd_prob (bool) – Whether to show the probability of the shaded area will be displayed on the plot. Defaults to
Trueadd_q (bool) – Whether the value(s) of
qshould be displayed on the x-axis of the plot. Defaults toTrueadd_legend (bool) – Whether a legend with the mean and standard deviation values will be displayed on the plot. Defaults to
Falsefigsize (tuple or tuple[float, float] or None) – The size of the plot in inches. If None, the default matplotlib figure size will be used as this is passed to
matplotlib.pyplot.figure(). Defaults to(8, 6)color (Any) – The color of the shaded area as a valid matplotlib color. Defaults to
xkcd:sky bluex_label (str) – The label for the x-axis. Defaults to
xy_label (str) – The label for the y-axis. Defaults to
f(x; μ,σ)legend_text (str or None, Optional) – The text to display in the legend if add_legend is set to true. By default (None), the legend will display the mean and standard deviation values.
**kwargs – Additional keyword arguments to pass to
matplotlib.pyplot.figure().
- Returns:
The generated matplotlib Figure object.
- Return type:
- Raises:
TypeError – If the input parameters are not of the expected type.
ValueError – If the input values are out of the expected range.
Examples
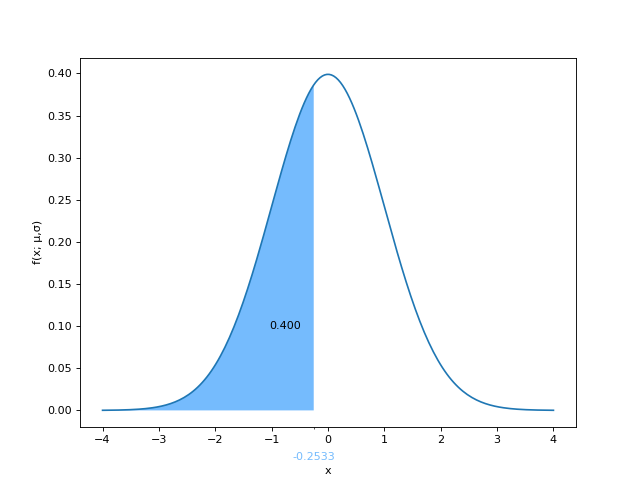
Shading the region \(P(Z \le z)\) where \(Z\sim N(0,1)\) is the standard normal
N(0,1)pbh.stats.shaded_normal_density(-0.2533)
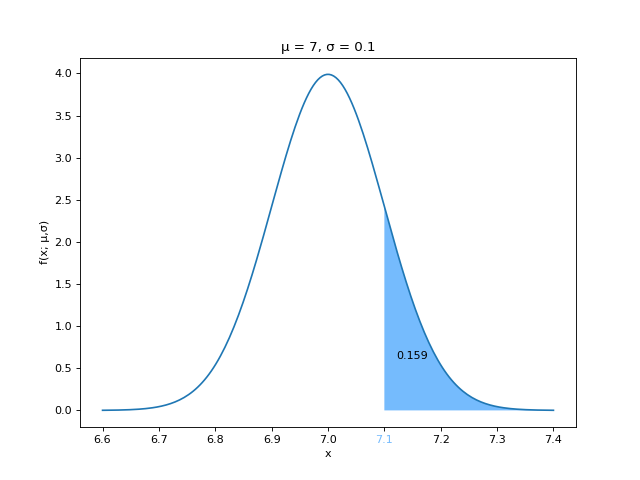
Shading the region \(P(Z \ge z)\) where \(Z\sim N(μ,σ)\) is a normal distribution with mean μ and standard deviation σ.
pbh.stats.shaded_normal_density(7.1, 7, 0.1, lower_tail=False, add_legend=True)
Shading the region \(P(a \le Z \le b)\) where \(Z\sim N(0,1)\) is the standard normal
N(0,1)pbh.stats.shaded_normal_density((-1.1, 2))

References
Based off of an R function written by Dr. Irene Vrbick for making shaded normal density curves.
The R function by Dr. Irene Vrbick was adapted from here.
- problem_bank_helpers.stats.shaded_hypothesis_test(critical_value: float, tail: Literal['left', 'right', 'both'], /, mean: float = 0, sd: float = 1, rsd: float = 4, figsize: tuple[float, float] | None = (8, 6), color: Any = 'xkcd:sky blue', x_label: str = 'x', y_label: str = 'Probability Density', legend: str | None = None, **kwargs) Figure[source]
Generate a normal distribution plot with appropriate tails for a hypothesis test.
- Parameters:
critical_value (float) – The critical value to plot. If
tailisboth,-abs(critical_value)is used for the left tail andabs(critical_value)is used for the right tail.tail (
leftorrightorboth) – The type of hypothesis test to plot.mean (float) – The mean of the normal distribution. Defaults to
0sd (float) – The standard deviation of the normal distribution. Defaults to
1rsd (float) – The number of standard deviations to plot on either side of the mean. Defaults to
4figsize (tuple or tuple[float, float] or None) – The size of the plot in inches. If None, the default matplotlib figure size will be used as this is passed to
matplotlib.pyplot.figure(). Defaults to(8, 6)color (Any) – The color of the shaded area as a valid matplotlib color. Defaults to
xkcd:sky bluex_label (str) – The label for the x-axis. Defaults to
xy_label (str) – The label for the y-axis. Defaults to
Probability Densitylegend (str or None, Optional) – The text to display in the legend (title) of the plot.
**kwargs – Additional keyword arguments to pass to
matplotlib.pyplot.figure().
- Returns:
The generated matplotlib Figure object.
- Return type:
- Raises:
TypeError – If the input parameters are not of the expected type.
ValueError – If the input values are out of the expected range.
Examples
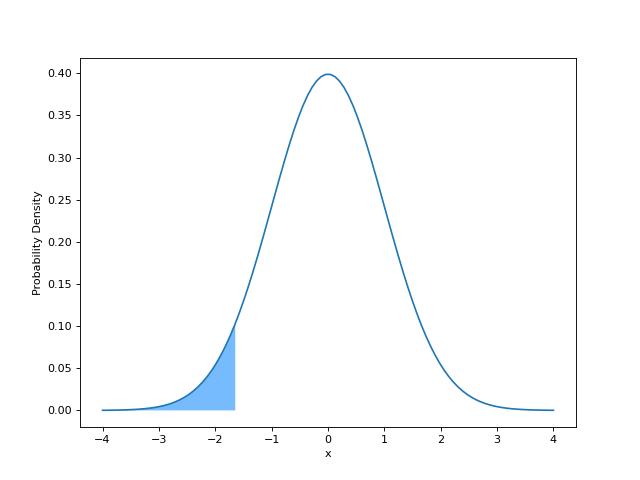
Left-tailed hypothesis test with a critical value of
-1.645for the standard normalN(0,1)pbh.stats.shaded_hypothesis_test(-1.645, "left")
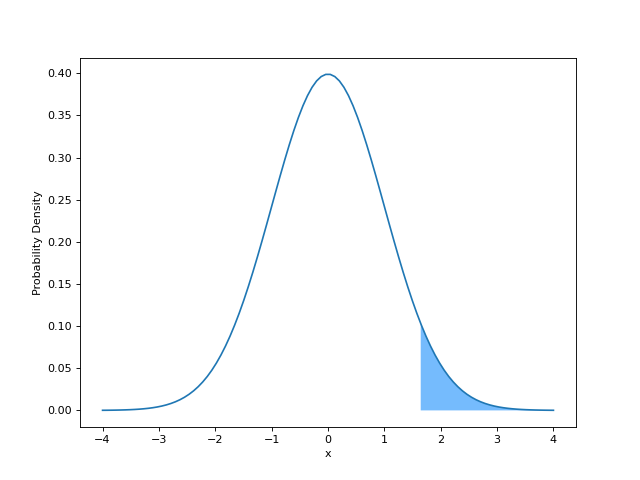
Right-tailed hypothesis test with a critical value of
1.645for the standard normalN(0,1)pbh.stats.shaded_hypothesis_test(1.645, "right")
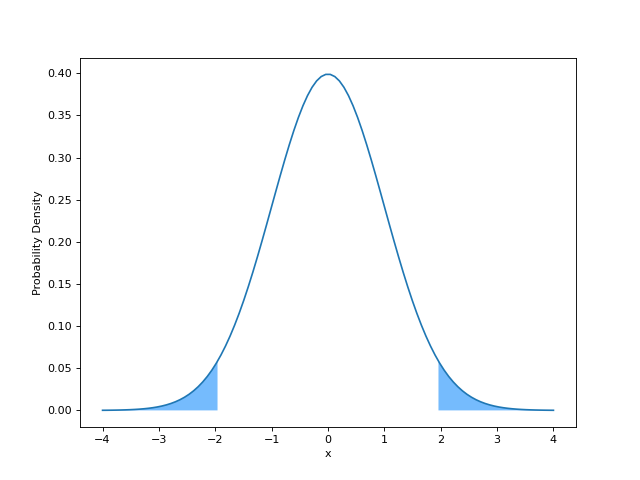
Two-tailed hypothesis test with a critical value of
±1.96for the standard normalN(0,1)pbh.stats.shaded_hypothesis_test(1.96, "both")